background-color: black background-position: center background-size: contain background-image: url(../images/kelp_minecraft.jpg) class: middle, inverse # From kelp foRests to coRonavirus ## an inteRactive jouRney in doing science<br/>with R ### Jarrett E.K. Byrnes ### UMass Boston --- class: middle ## Thanks to Karthik Ram, Kyle Edwards, Jay Stachowicz, and others who facilitated or tolerated grad school R chicanery. ## Thanks to NCEAS fellows and working group collaborators. ## Thanks to students who have put up with learning R and data science from me. ##Thanks to all who have ever contributed to R in any way. --- class: inverse .center[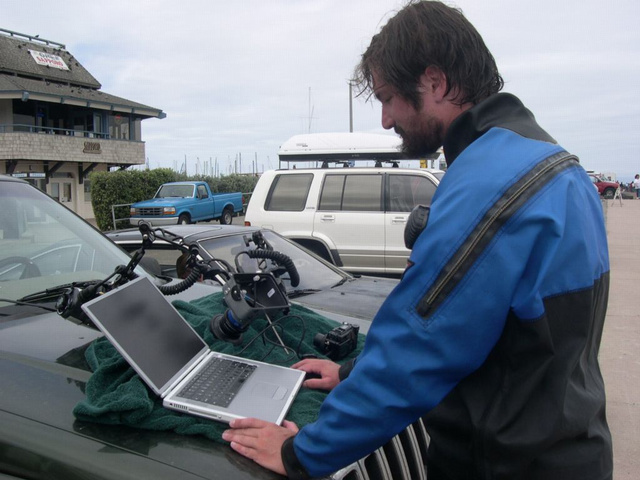] # Hello! I will be your tour guide through my mind today! --- class: center, middle # Your methods guide your science --- class: center, middle # Do not stop learning. Ever. --- class: middle # Or really.... this is to your benefit! .center[ 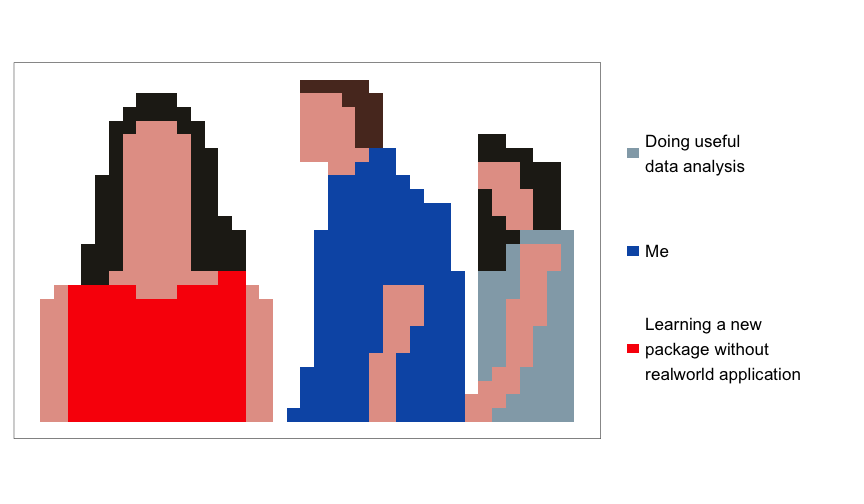<!-- --> ] .left[Credit @ashten28] --- # How I started R .center[ 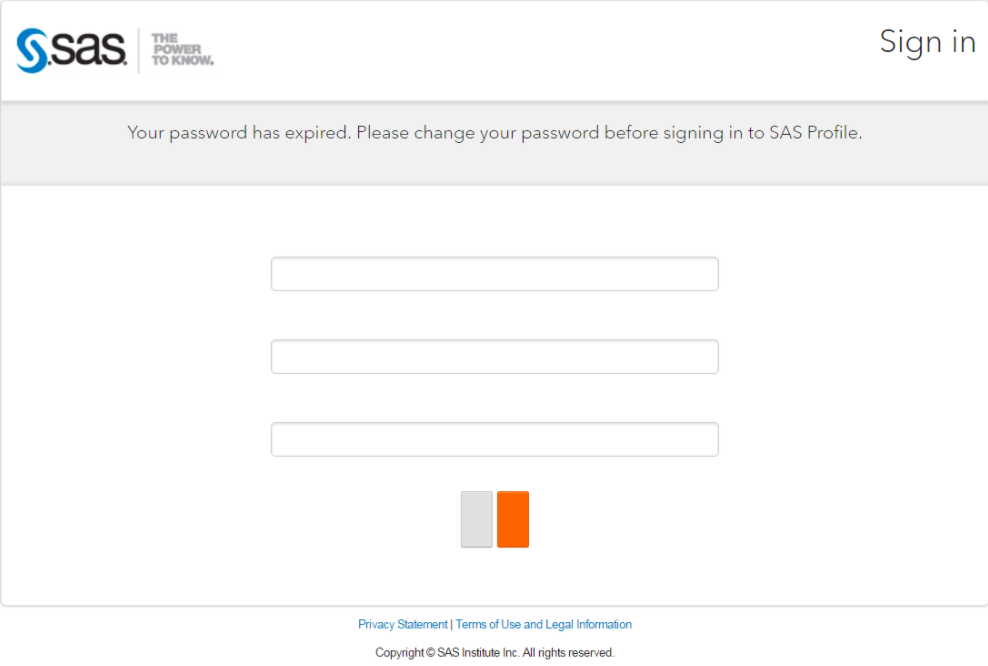 ] --- .pull-left[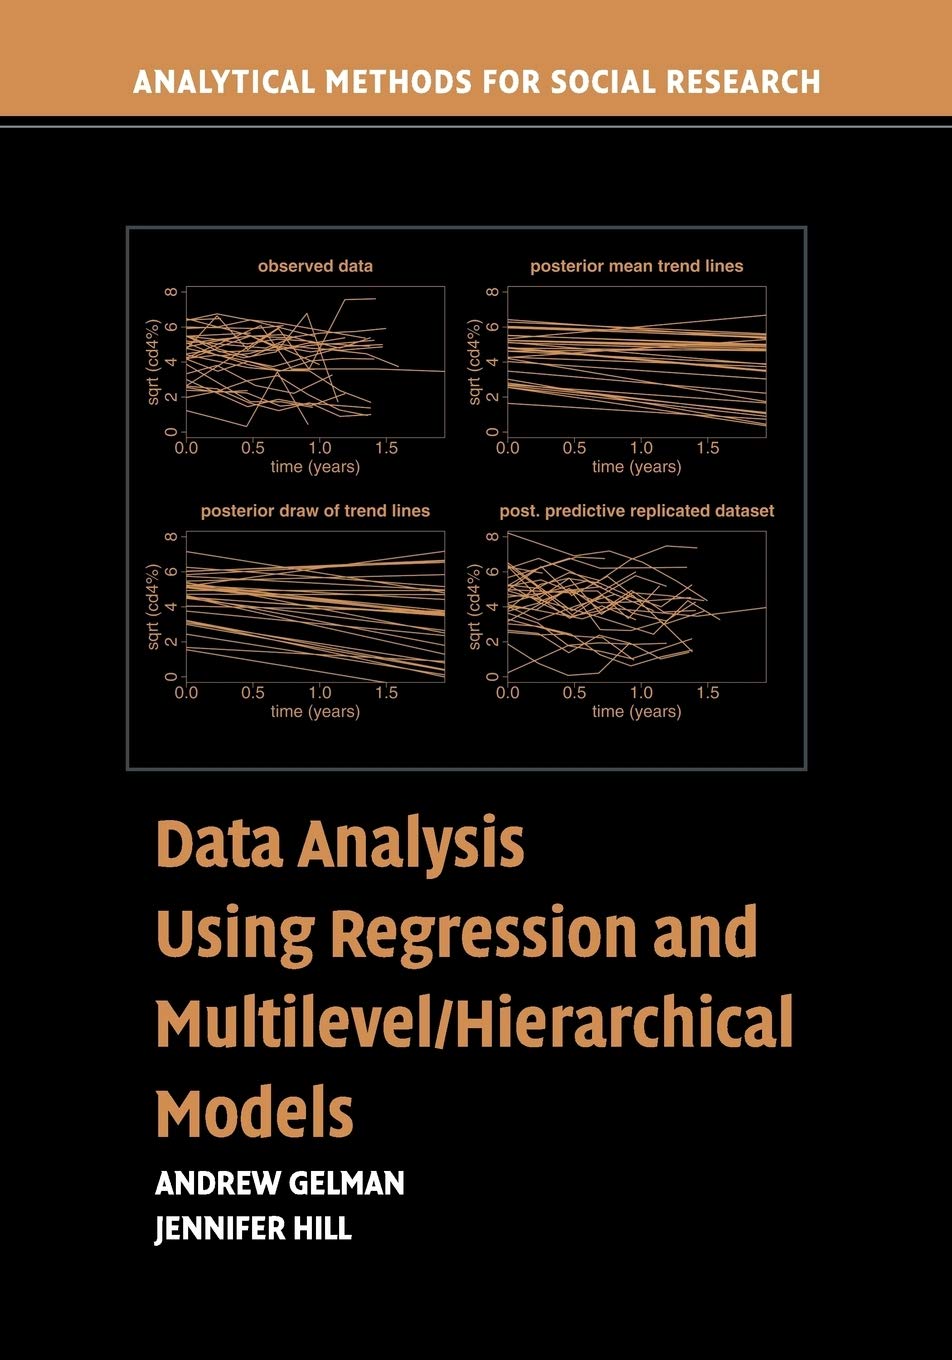] -- .pull-right[] ??? The mixed model course with a book that integrated R not only opened up my quantative skills, but the idea that R could be used as a teaching tool blew my mind. I also started to learn how you could use R to understand complex concepts. That for many students - and many on this call - all of the equations in the world won't make a fig. But seeing something in action on a computer screen, or in a boiled down notation that made a computer do something - that was a real way to learning. --- # More On the Job Learning... -- .image-400[.center[]] --- # More On the Job Learning... .image-80[.center[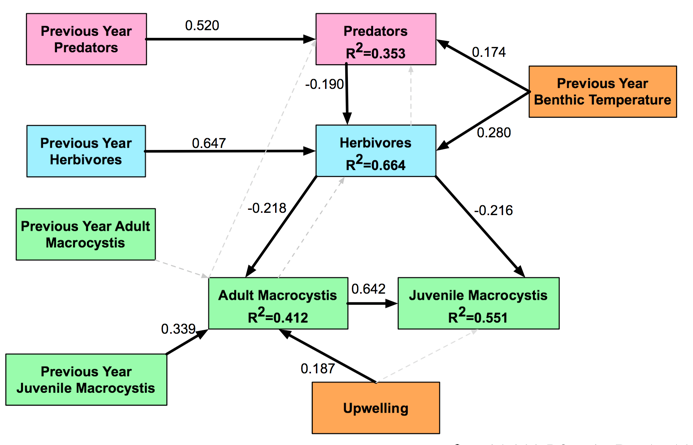]] --- class: center, middle, inverse  --- background-color: black background-position: center background-size: contain background-image: url(../images/darkside.jpg) ??? https://www.entertainart.com/star-wars/the-power-of-the-dark-side/ --- background-color: black background-position: center background-size: contain background-image: url(../images/clabuesch_Nereo_forest-1.JPG) class: bottom, inverse, left .small[Photo by Steve Clabuesch] --- background-color: black background-position: center background-size: contain background-image: url(../images/nceas_kelp_working_group.jpg) class: bottom, inverse # NCEAS Kelp-Climate Working Group, 2012 --- background-color: black class: inverse # Our Goal .center[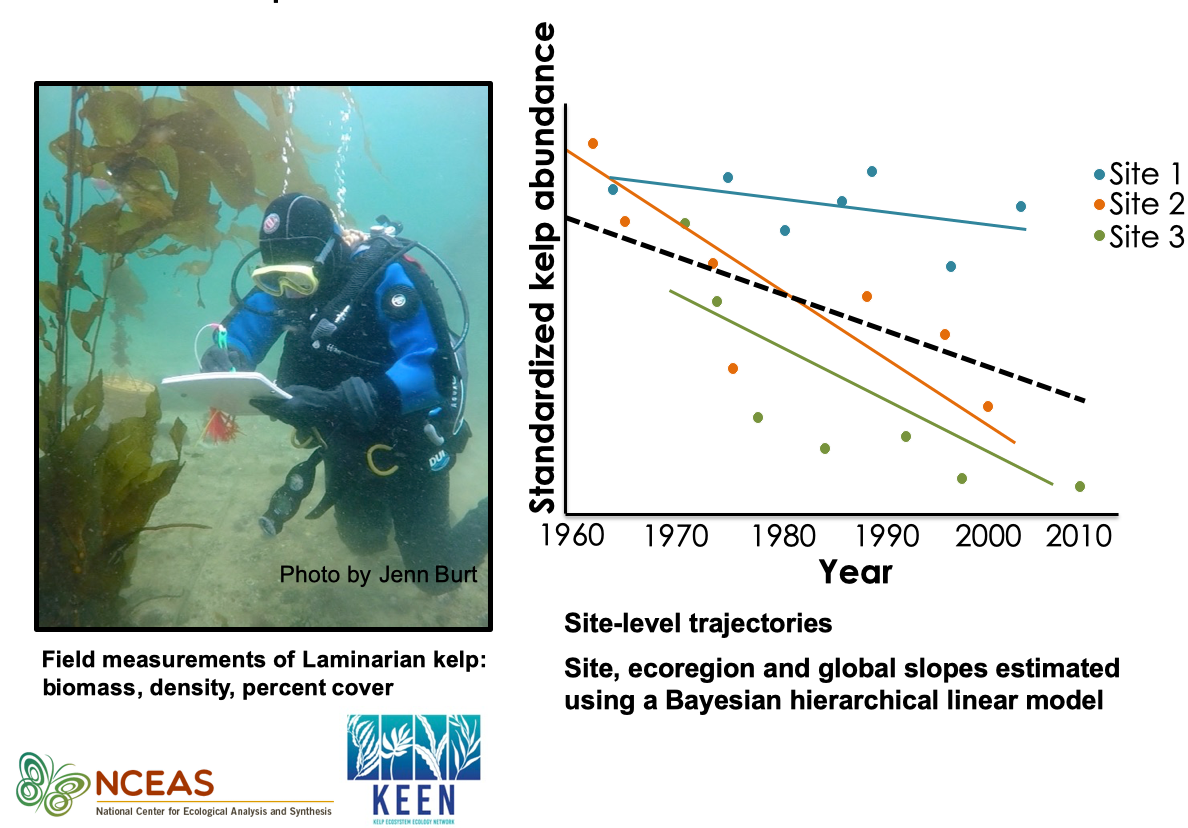] --- class: middle # Reality Check - Other People's Data is Messy .center[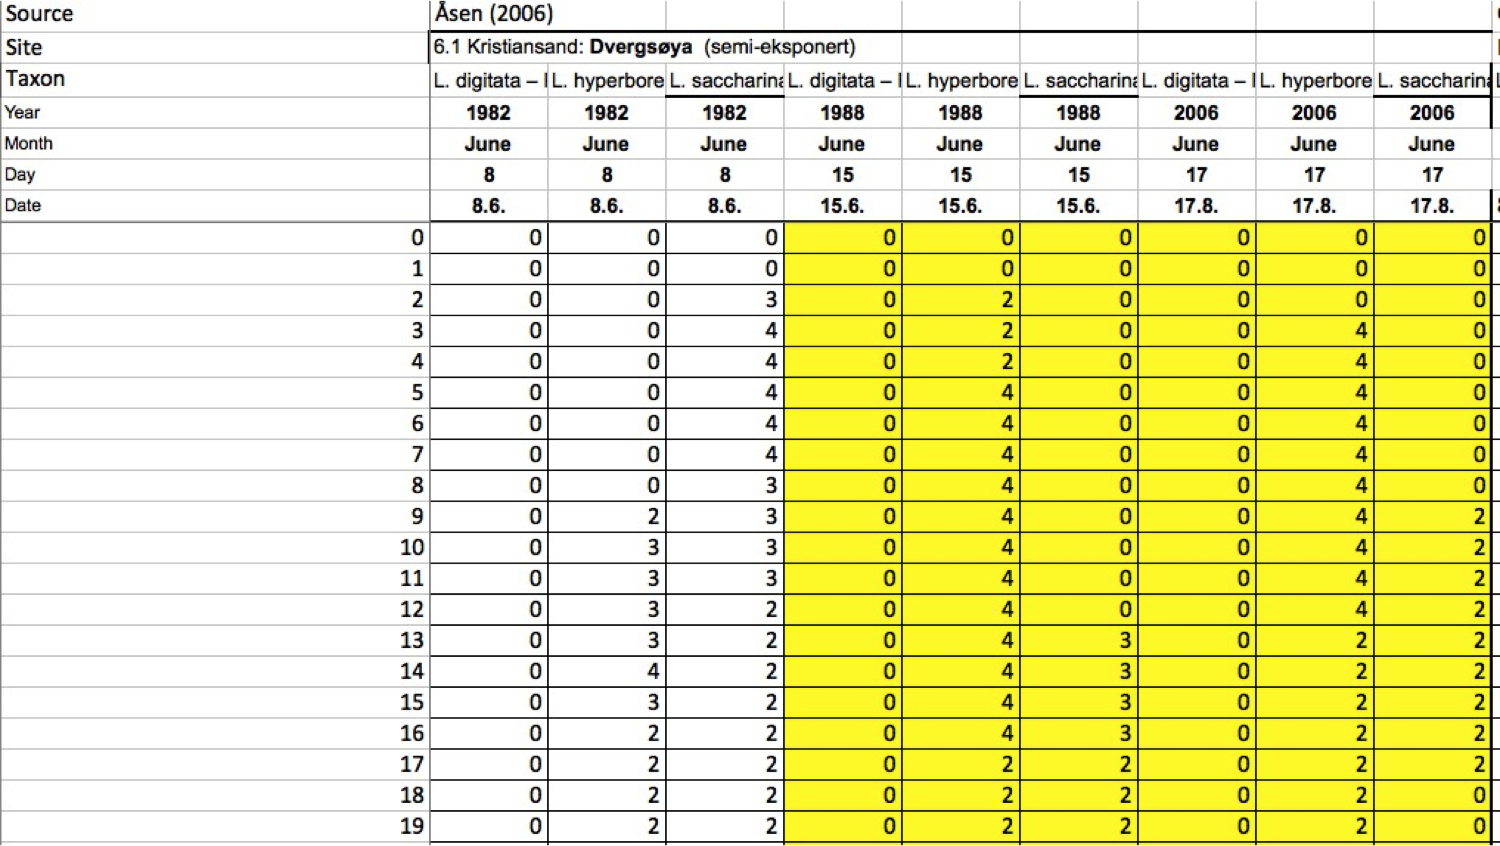] --- class: middle # Reality Check - Other People's Data is Messy .center[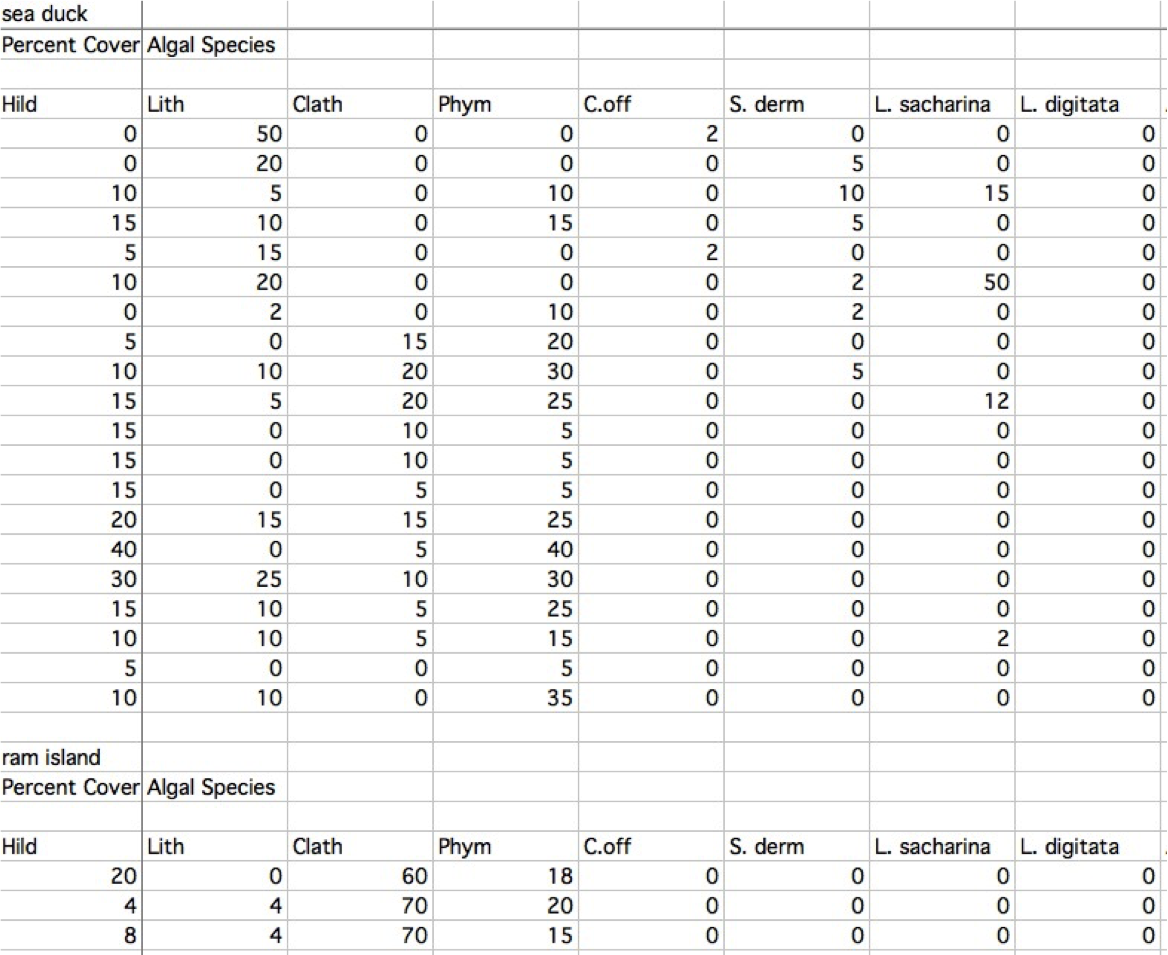] --- class: middle # Reality Check - Other People's Data is Messy .center[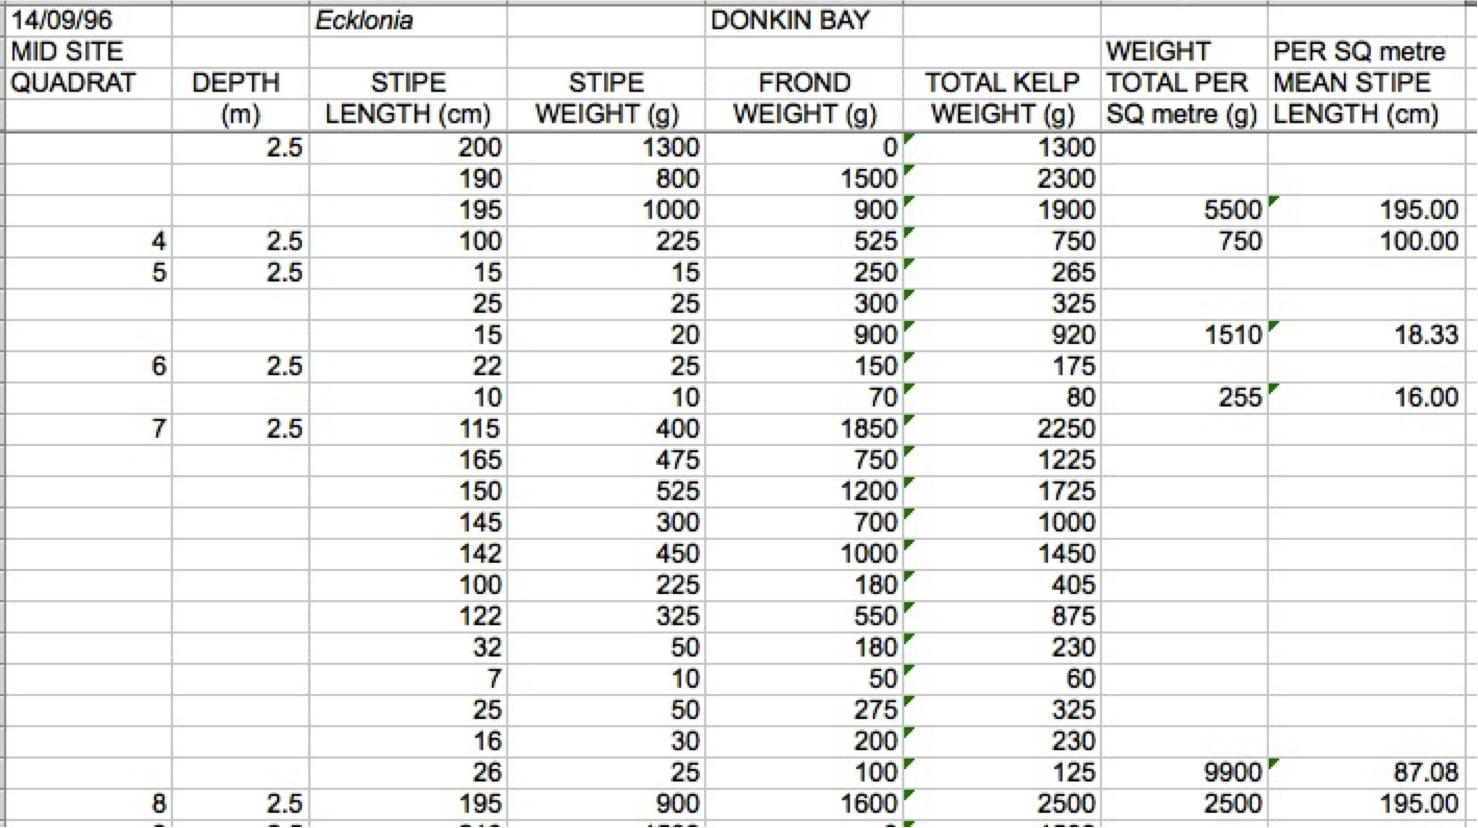] --- class: middle # Reality Check - Other People's Data is Messy .center[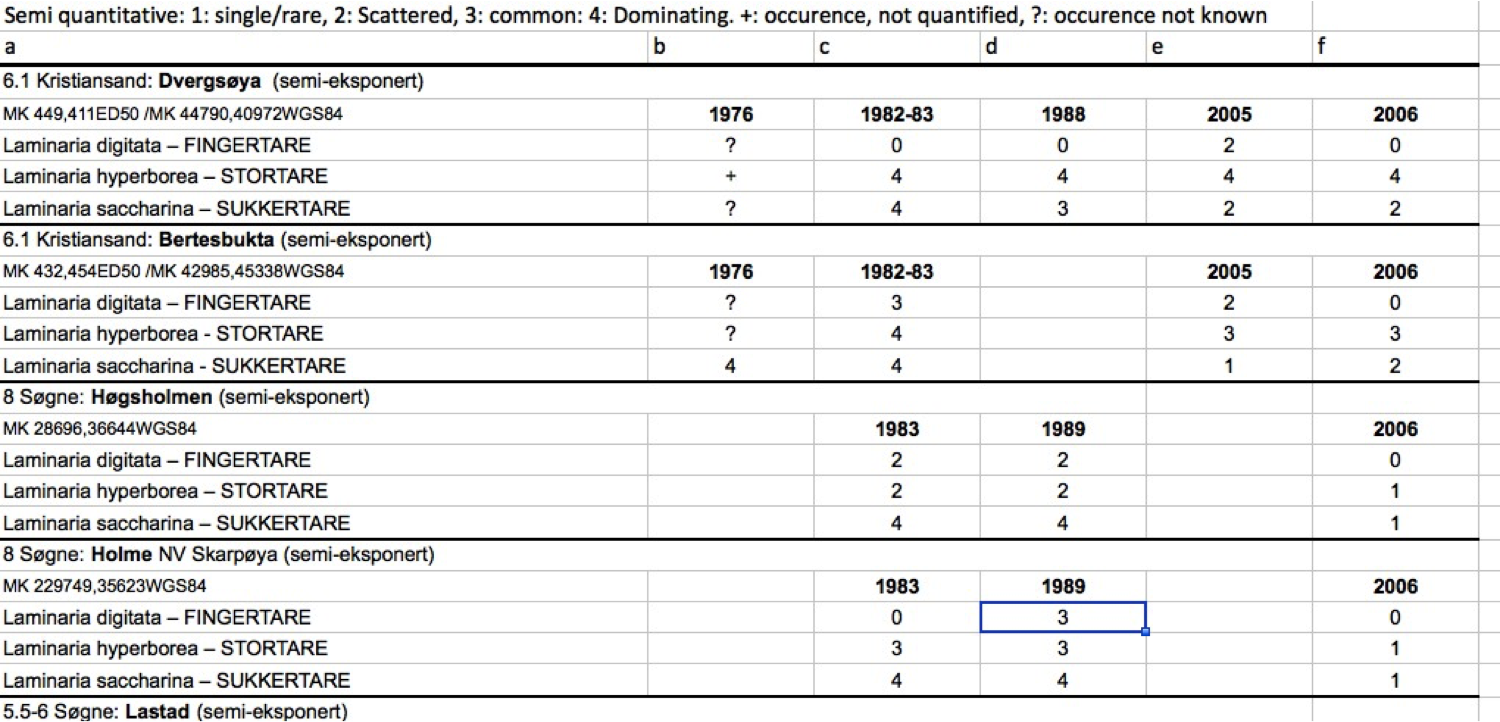] --- # Our Saviour .center[.image-80[]] --- # In Which We Are Baptized as Data Scientists .pull-left[ 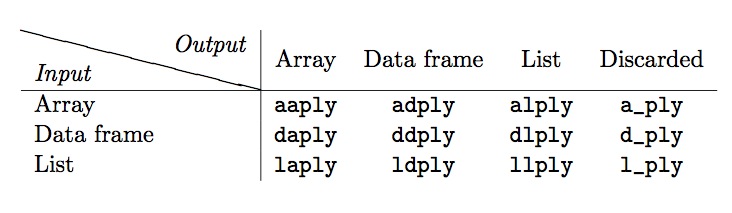 ] -- .pull-right[   ] --- class: middle # Data manipulation with plyr ```r ######### 3) Create Derived Data Set at lowest sample unit #remove the date column, as it screws up ddply kelpcover$Date <- as.character(kelpcover$Date) temporal_data <- ddply(kelpcover, c("Sample.Year", "Sample.Month", "Quad"), summarise, Stipe.Density.num.per.sq.m = length(Quad), Individual.Density.num.per.sq.m = length(Quad), Biomass.kg.wet.per.sq.m = sum(St.wght)+sum(Fr.wght), Depth.m = max(Depth, na.rm=T)) #correct for rows that have 0 plants zeroPlants <- which(temporal_data$Biomass.kg.wet.per.sq.m==0) temporal_data$Individual.Density.num.per.sq.m[zeroPlants] <- 0 temporal_data$Stipe.Density.num.per.sq.m[zeroPlants] <- 0 names(temporal_data)[names(temporal_data)=="Quad"] <- "Sample.ID" ``` --- class: middle # Data manipulation with plyr ```r ######### 3) Create Derived Data Set at lowest sample unit *#remove the date column, as it screws up ddply kelpcover$Date <- as.character(kelpcover$Date) temporal_data <- ddply(kelpcover, c("Sample.Year", "Sample.Month", "Quad"), summarise, Stipe.Density.num.per.sq.m = length(Quad), Individual.Density.num.per.sq.m = length(Quad), Biomass.kg.wet.per.sq.m = sum(St.wght)+sum(Fr.wght), Depth.m = max(Depth, na.rm=T)) #correct for rows that have 0 plants zeroPlants <- which(temporal_data$Biomass.kg.wet.per.sq.m==0) temporal_data$Individual.Density.num.per.sq.m[zeroPlants] <- 0 temporal_data$Stipe.Density.num.per.sq.m[zeroPlants] <- 0 names(temporal_data)[names(temporal_data)=="Quad"] <- "Sample.ID" ``` --- class: middle # Data grouping with plyr ```r ######### 3) Create Derived Data Set at lowest sample unit #remove the date column, as it screws up ddply kelpcover$Date <- as.character(kelpcover$Date) *temporal_data <- ddply(kelpcover, c("Sample.Year", * "Sample.Month", * "Quad"), summarise, Stipe.Density.num.per.sq.m = length(Quad), Individual.Density.num.per.sq.m = length(Quad), Biomass.kg.wet.per.sq.m = sum(St.wght)+sum(Fr.wght), Depth.m = max(Depth, na.rm=T)) #correct for rows that have 0 plants zeroPlants <- which(temporal_data$Biomass.kg.wet.per.sq.m==0) temporal_data$Individual.Density.num.per.sq.m[zeroPlants] <- 0 temporal_data$Stipe.Density.num.per.sq.m[zeroPlants] <- 0 names(temporal_data)[names(temporal_data)=="Quad"] <- "Sample.ID" ``` --- class: middle # Data summarization with plyr ```r ######### 3) Create Derived Data Set at lowest sample unit #remove the date column, as it screws up ddply ] kelpcover$Date <- as.character(kelpcover$Date) temporal_data <- ddply(kelpcover, c("Sample.Year", "Sample.Month", "Quad"), * summarise, Stipe.Density.num.per.sq.m = length(Quad), Individual.Density.num.per.sq.m = length(Quad), Biomass.kg.wet.per.sq.m = sum(St.wght)+sum(Fr.wght), Depth.m = max(Depth, na.rm=T)) #correct for rows that have 0 plants zeroPlants <- which(temporal_data$Biomass.kg.wet.per.sq.m==0) temporal_data$Individual.Density.num.per.sq.m[zeroPlants] <- 0 temporal_data$Stipe.Density.num.per.sq.m[zeroPlants] <- 0 names(temporal_data)[names(temporal_data)=="Quad"] <- "Sample.ID" ``` --- class: middle # Still no easy rename... ```r ######### 3) Create Derived Data Set at lowest sample unit #remove the date column, as it screws up ddply kelpcover$Date <- as.character(kelpcover$Date) temporal_data <- ddply(kelpcover, c("Sample.Year", "Sample.Month", "Quad"), summarise, Stipe.Density.num.per.sq.m = length(Quad), Individual.Density.num.per.sq.m = length(Quad), Biomass.kg.wet.per.sq.m = sum(St.wght)+sum(Fr.wght), Depth.m = max(Depth, na.rm=T)) #correct for rows that have 0 plants zeroPlants <- which(temporal_data$Biomass.kg.wet.per.sq.m==0) temporal_data$Individual.Density.num.per.sq.m[zeroPlants] <- 0 temporal_data$Stipe.Density.num.per.sq.m[zeroPlants] <- 0 *names(temporal_data)[names(temporal_data)=="Quad"] <- "Sample.ID" ``` --- # reshape2 as a "clever" way of adding 0s ```r # Ensure there are zero entries for all species # Melt to long first dat2<-melt(dat, measure.vars='Count') # Cast to wide # absences are treated as zero counts, not missing surveys # and will fill in 0 dat3<-dcast(dat2, ... ~ Taxon, fill=0) # re-melt to long for data standard dat4<-melt(dat3, id.vars = names(dat3)[1:6], measure.var = names(dat3)[8:9], variable.name = 'Taxon', value.name = 'Count') ``` --- background-color: black background-position: center background-size: contain background-image: url(../images/hailey_born.jpeg) --- background-color: black background-position: center background-size: contain background-image: url(../images/hailey_sleeping.jpeg) --- # New Saviours! .pull-left[] .pull-right[] --- # I am now a full convert .center[] --- # Floating Forests  http://floatingforests.org --- # Circle the Forests! The Data will be Easy, Right? 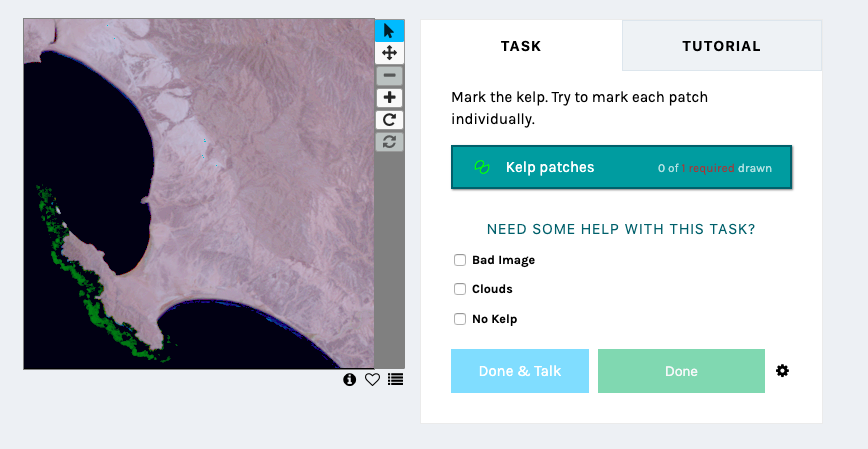 http://floatingforests.org --- # Floating Forets - the data - Gigabytes of data -- - JSON shoved into a CSV -- - The individual classifications: .font-courier[ {""path"":""M 408.296875,142 L 406.296875,141 L 400.296875,137 L 390.296875,130 L 365.296875,120 L 335.296875,106 L 308.296875,96 L 294.296875,92 L 282.296875,91 L 270.296875,90 L 260.296875,90 L 255.296875,93 L 245.296875,105 L 237.296875,122 L 231.296875,139 L 222.296875,160 L 217.296875,179 L 215.296875,195 L 214.296875,206 L 214.296875,216 L 222.296875,227 L 234.296875,235 L 248.296875,244 L 254.296875,247 L 261.296875,250 L 264.296875,251 L 265.296875,252 Z"",""tool"":0,""frame"":0,""details"":[],""tool_label"":""Marking tool""} ] --- class:middle, center .image-50[] --- # Complex Geospatial Visulization and Time-Series Analysis now Possible .center[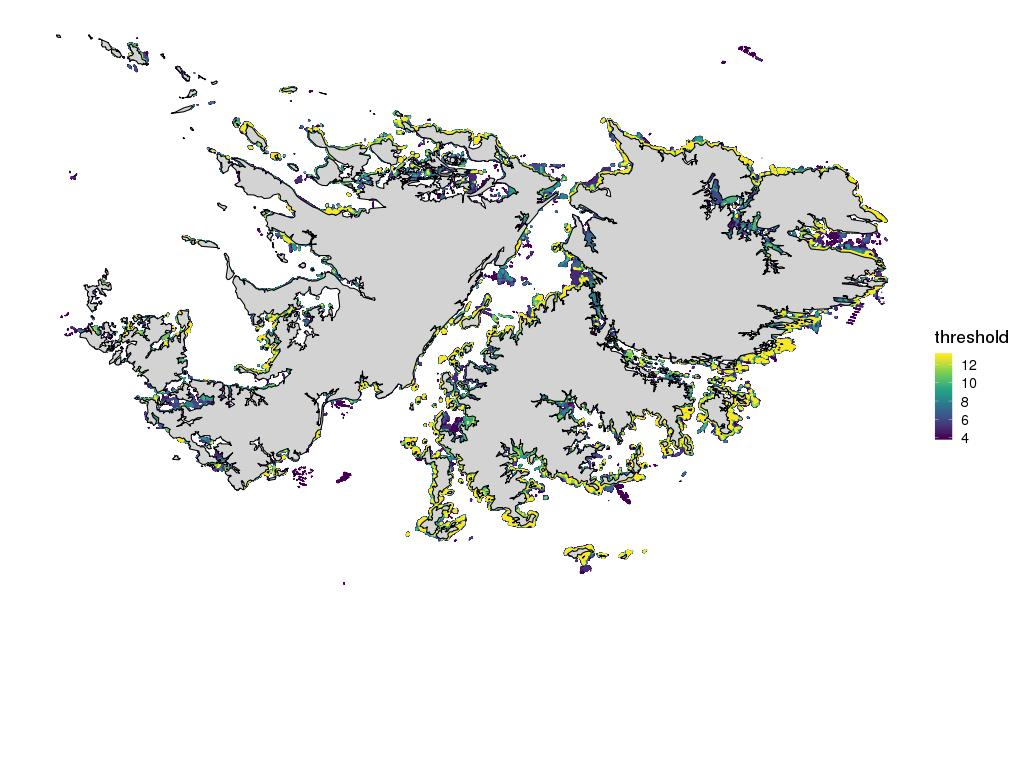] --- class: center, middle # Your methods guide your science --- class: center, middle # Do not stop learning. Ever. --- # Teaching Keeps you Nimble! .center[] --- # Teaching Keeps you Fresh! .center[] --- # New R Packages Find You Even When You Don't Expect It .center[] .bottom[.left[https://jebyrnes.shinyapps.io/logistic_growth/]] --- # Teaching Makes You Current! .center[] ??? twitter as helper as well --- class: middle, center, inverse .image-50[] --- class: middle, center, inverse  --- class: middle, inverse # Making R Relevant to Students .center[] --- class: middle, inverse # Let Students use R to Explore Relevant Data .center[] --- class: middle, inverse # Relevant Data Speeds Learning New Data Science Tools .center[] --- class: middle, inverse # Massive Returns on Learning R in the Long-Term .center[] --- # Massive Returns on Learning R in the Long-Term .center[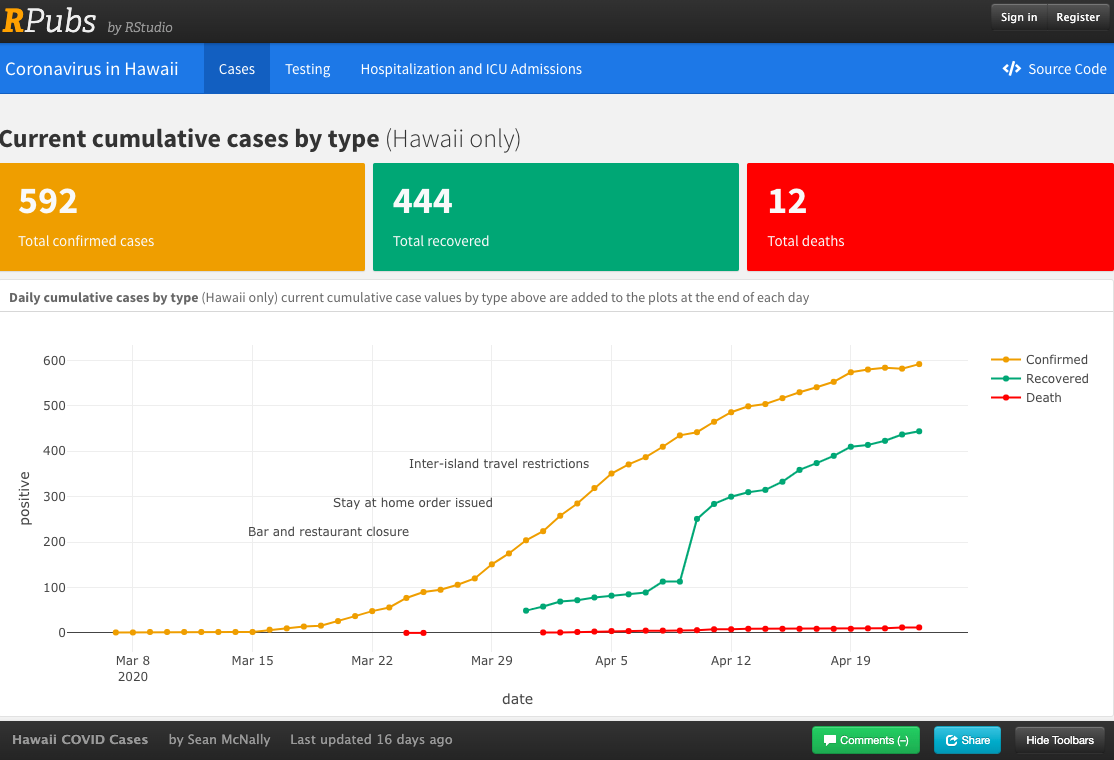] --- class: inverse, middle # sometimes...seRendipity .pull-left[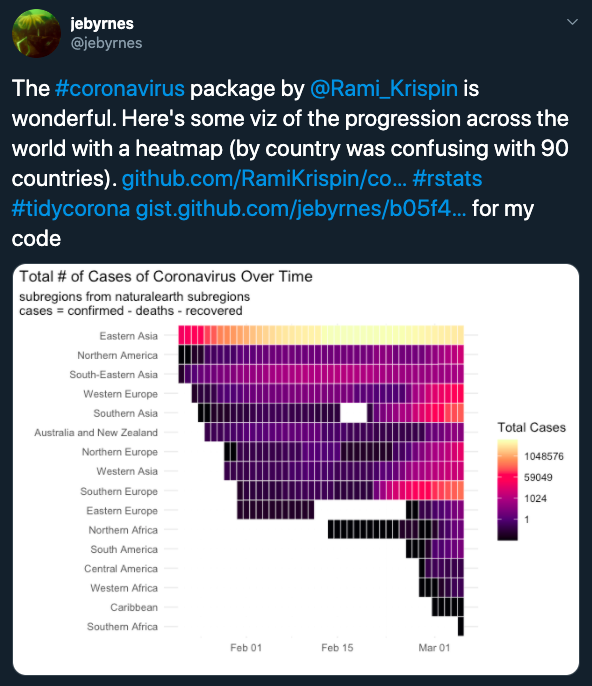] -- .pull-right[] --- class: inverse, middle # The Covid19R Project Team .center[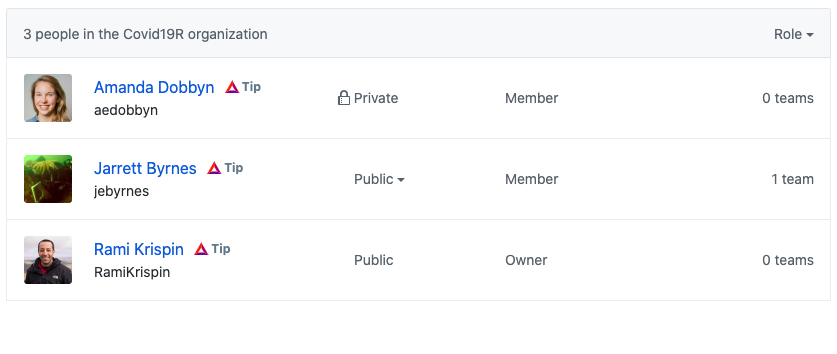] --- class: inverse, middle # Tidy Covid-19 Data .center[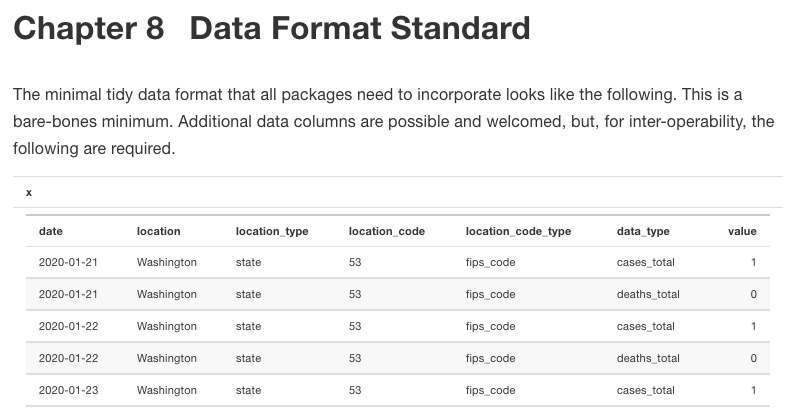] --- class: inverse, middle # Making a Community Project #### https://covid19r.github.io/documentation/ .center[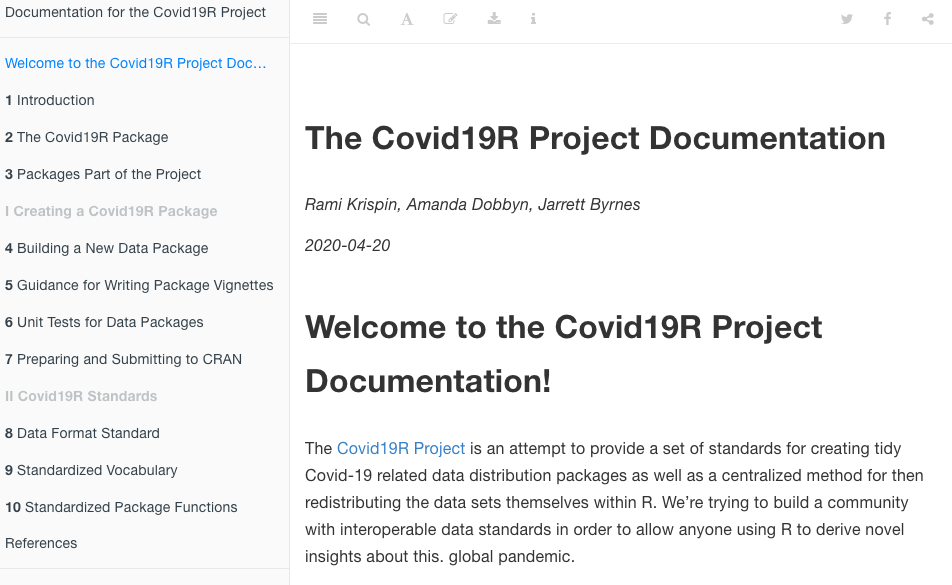] --- class: inverse, middle # Building Resources for Novices to Learn Package Building #### https://github.com/Covid19R/covid19_package_template .center[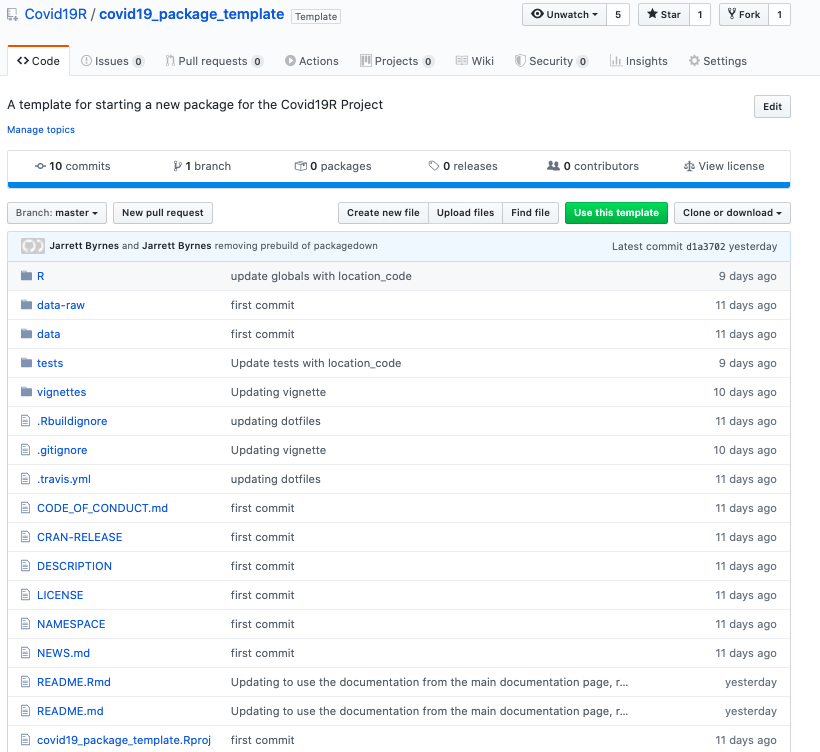] --- class: inverse, middle # Enabling a Community #### https://github.com/Covid19R .center[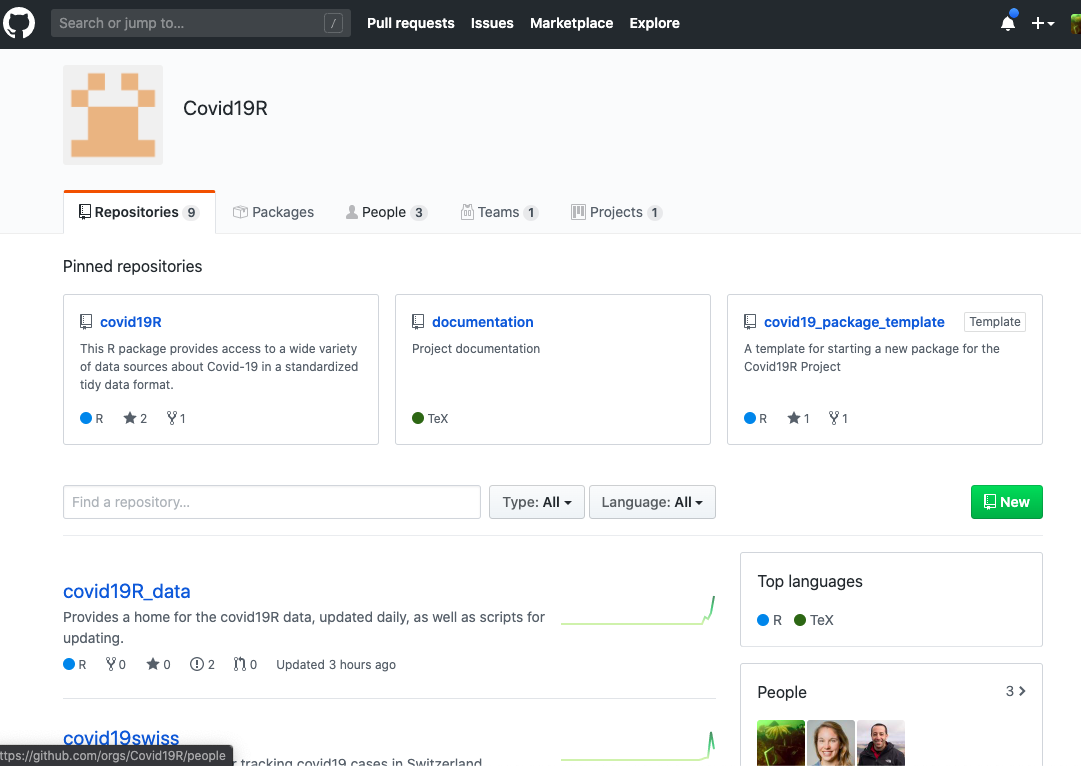] ??? This has been transformative for me, and I don't know where it is going to go from here. --- class: center, middle # Your methods guide your science --- class: center, middle # Do not stop learning. Ever. --- class: middle #As I started writing this talk... ```r > install.packages("xaringan") also installing the dependency ‘servr’ trying URL 'https://cran.rstudio.com/bin/macosx/el-capitan/contrib/3.6/servr_0.16.tgz' Content type 'application/x-gzip' length 85778 bytes (83 KB) ================================================== downloaded 83 KB ``` --- class: middle # Questions? .center[ <!-- --> ] .left[Credit @ashten28] ---